





Uber in 2024
- $44.0B
- Revenue, up 18% year on year
- 11.27B
- Trips, up from 3.7B in 2017
- 171M
- Monthly active consumers (Q4)
- ~76%
- Share of US rideshare spending (Mar 2024)
01 · The Company
The Company
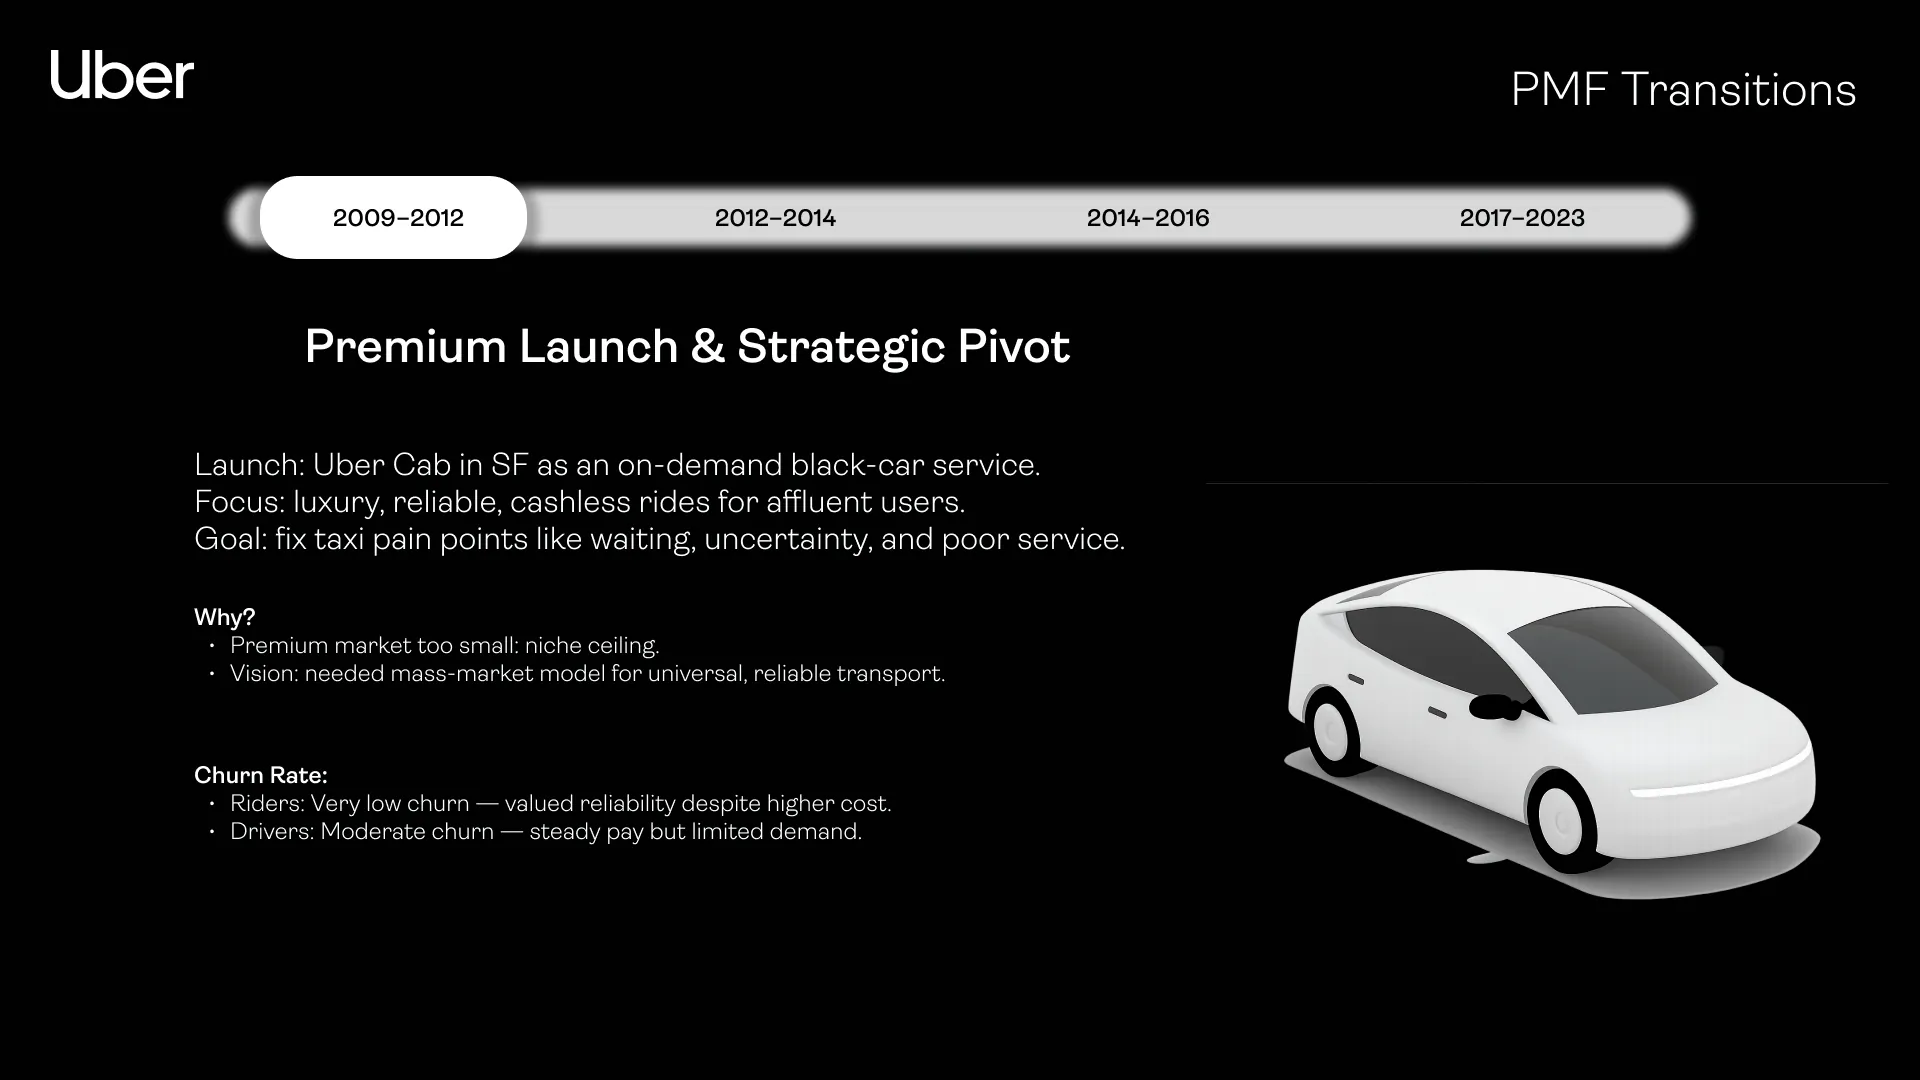
Uber started in 2009 as UberCab, an on-demand black-car service in San Francisco. The pitch was simple: tap a button and a reliable, cashless ride shows up, with none of the waiting and uncertainty of hailing a taxi. It was a premium product for affluent riders.
Fifteen years later, Uber connects people with rides, food and grocery delivery and freight in about 70 countries and more than 15,000 cities. In 2024 it completed 11.27 billion trips, three times as many as in 2017, and took about three of every four dollars Americans spent on rideshare.
What makes Uber interesting to study as a product isn’t its size; it’s that it got there by finding product–market fit more than once. Every time it changed its price point or its category, it was effectively launching a new product that had to earn its own fit.
02 · The Details
Four Eras of Fit
Premium launch (2009–2012). The black-car product worked: riders valued reliability enough to pay more, so rider churn was very low. Drivers had steady pay but limited demand. The problem was the ceiling. The premium market was too small for Uber’s ambition of universal, reliable transport.
Mass-market expansion (2012–2014). UberX, launched in July 2012, let people drive their own cars part-time at much lower fares, and Uber rolled it out globally in a “land grab” to outpace Lyft. Affordability made Uber a daily habit and more riders and drivers strengthened network effects, but driver turnover surged, forcing constant recruiting.
Diversification (2014–2016). uberPOOL (2014) shared rides for lower fares and better utilisation, and Uber Eats (2014–15) gave people a second reason to open the app. This was the rare phase that helped both sides: Eats kept riders engaged when they weren’t travelling, and deliveries topped up drivers’ earnings.
Efficiency and profitability (2017–2023). After a decade of losses, the focus moved to unit economics: higher commissions, cost cuts, and new revenue lines in Uber Freight, advertising and partnerships. In 2023 Uber posted its first full-year operating profit.
| Era | Rider churn | Driver churn |
|---|---|---|
| Premium (2009–12) | Very low: reliability was worth the price | Moderate: steady pay, limited demand |
| UberX (2012–14) | Fell: cheap rides became a daily habit | Surged: constant recruiting needed |
| Diversification (2014–16) | Fell further: Eats kept users engaged | Eased: deliveries added earnings |
| Profitability (2017–23) | Minor rise from fare hikes | Still high, softened by incentives |
Driver churn is also a lesson in how much a metric depends on its definition. Research by Uber’s own economist with Alan Krueger found that about half of drivers were still active a year after starting. A 2017 report in The Information found that only about 4% of people who signed up were still driving a year later, because it counted the whole funnel: only some sign-ups passed vehicle inspection, fewer took a first trip, and about a quarter of those were still driving after a year. Both numbers are true; they answer different questions.
02 · The Details
Sizing the Opportunity
In its 2019 IPO filing, Uber sized its personal-mobility market at 11.9 trillion miles a year across 175 countries. We used its numbers, and deliberately didn’t reduce the obtainable market to a single figure:
TAM
$5.7 trillion
All personal mobility in 175 countries.
SAM
$2.5 trillion
The part of that in the 63 countries Uber operated in at its IPO.
SOM
Varies by city
Set by driver supply, competition and regulation, city by city.
03 · The Business
The Business Today
Uber makes most of its money by taking a share of every ride and delivery booked on the platform, and it has added freight, advertising and a paid membership on top. The turn to profit shows up clearly in the numbers:
| Metric | 2023 | 2024 |
|---|---|---|
| Revenue | $37.3B | $44.0B |
| Income from operations | $1.1B (first full year of operating profit) | $2.8B |
| Net income | $1.9B (helped by investment gains) | $9.9B (includes a $6.4B one-time tax benefit) |
| Trips | 9.45B | 11.27B |
| Monthly active consumers (Q4) | 150M | 171M |
Source: Uber’s Q4 2023 and Q4 2024 earnings releases. Operating income is the cleaner measure of the business; net income swings with one-off items.
Notice where the newer growth comes from: not new cities, but earning more from the people already on the platform. The Uber One membership reached 30 million members by the end of 2024, and advertising passed a $1 billion annual revenue run rate the same year. Both only work because Uber already has the users, the trips and the trust.
04 · My Take
My Take
Studying Uber changed how I think about product–market fit. It isn’t a box you tick once; it’s something you have to re-earn every time you change who you serve or what you charge. Fit with affluent riders in San Francisco said nothing about fit with daily commuters on UberX.
I think Uber’s real product is reliability, not rides. The original promise of a ride that shows up when you need it survived every era, even as the price, the car and the category changed. Eats and Uber One extend the same promise to more parts of your day.
The driver side is the part I’d worry about most if I were a PM there. Almost every rider-side win, like cheaper UberX fares, made driver churn worse, and even the most generous measure loses about half of drivers within a year. Incentives treat the symptom. I’d treat predictable driver earnings as a core product metric, not an operations cost, because supply is what the rider experience is built on.
I’m also cautious about reading the profit as proof of a universal model. Uber’s pricing power comes from dominating individual cities, and network effects are local: it wins or loses city by city. That’s exactly why a single global SOM would have been misleading.
If I redid our analysis, I’d size the market bottom-up (trips per city × achievable share × average fare) instead of borrowing Uber’s top-down IPO numbers. I’d also drop claims we couldn’t source: our deck cited a 2015 Net Promoter Score of about 37, which I couldn’t trace to a primary source, so it isn’t on this page.
04 · My Take
Sources
- Uber Q4 & full-year 2024 results
- Uber Q4 & full-year 2023 results (SEC)
- Uber S-1 registration statement, 2019 (SEC)
- Uber 2024 annual report, Form 10-K (SEC)
- Uber Q2 2024 results: advertising revenue run rate (SEC)
- Bloomberg Second Measure: Uber vs. Lyft US rideshare share
- CNBC: Only 4% of Uber drivers remain after a year (2017)